
Risk Assessments with Expectation Chains
Dependencies and empirical risk assessments with expectation chains
SaaS operators live and die by dependency reality! Revenue, reputation, and regulatory exposure are shaped less by any single component’s quality than by the coupled behavior of many components: customer identity, edge delivery, application services, data stores, queues, third-party APIs, CI/CD, cloud primitives, and human response systems. The operational consequence is familiar: incidents rarely remain local. A latent defect in one service can become an outage when combined with a traffic surge, a retry storm, a quota limit, or a degraded network path. In this environment, “risk” is not a property of an isolated asset; it is a property of a dependency graph.
Most often risk comes from a change (whether planned or unplanned). The cascading failure from misperceived risk or unexpected disruption to the business can cost a fortune in very little time, either as direct costs or as opportunity cost due to lost productivity both for a company and its customers. As an example, there was an outage caused by a contractor at a data center once. The contractor was actioning a change request to remove deprecated network hardware. Internal network engineers had followed change management practices, ranking the change as "low risk" because they had already logged in and disabled the network equipment, failing over to redundant gear. But what should have been a short 15-minute change turned into an hour-long global outage when the contractor unplugged and removed the network gear without realizing the labels on the gear were wrong. The equipment the contractor had removed was, in fact, the live equipment and not the deprecated units. This change, in retrospect, should never have been a "low risk" event. Had it been rated as a higher risk, company policy provided that the contractor would have had to be on his cell phone with network engineering during the change; pre-change notifications would have been sent company wide to minimize any confusion if things went badly. But as a "low risk" change, only the contractor knew the exact time of the change (network engineering knew only the day), and valuable minutes were lost in the confusion of a global outage impacting both product operations as well as internal communications among incident responders.
Historically, many organizations have treated risk assessment as a qualitative exercise—often a low/medium/high spectrum built from “expert judgment,” much like the story just described. Qualitative scales are not inherently wrong; they are frequently necessary when data is missing. But qualitative methods struggle to maintain business-wide context, to compare risks across domains, and to defend prioritization decisions when multiple stakeholders compete for scarce engineering capacity. Modern risk guidance explicitly acknowledges that risk determination may be qualitative, semi-quantitative, or quantitative, depending on purpose and available evidence (National Institute of Standards and Technology [NIST], 2012). The practical problem for SaaS operators is that qualitative assessments often persist even after instrumentation exists that could make risk arguments empirical and continuously updated.
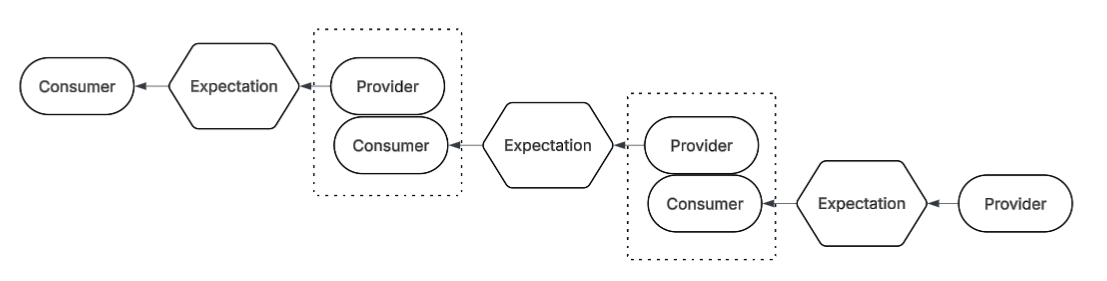
Expectation chains are a graph-based approach to turn dependency reality into measurable promises. They model a service interaction as Provider → Expectation ← Consumer, where the “Expectation” is a declarative, testable statement of what must be true for business value to flow. Each expectation decomposes into three measurable axes: availability (can the consumer reach the provider), reliability (is the output correct for the input), and performance (is it delivered within the defined time window). The chain forms as expectations are recursively defined from customer outcomes down through internal and external dependencies. This structure is not merely a visualization; it is an empirical risk model because every edge and node can be grounded in observed evidence—probes, traces, metrics, and failure outcomes—rather than subjective labels.
Why dependency graphs are the right abstraction for SaaS risk
Dependency graphs are already a standard way to represent microservice and platform relationships: services as nodes, dependencies as edges, and (in richer forms) edges labeled by call paths, RPC methods, or dependency types. Service dependency graphs can be built statically from configuration or dynamically from distributed tracing and telemetry (e.g., tracing-derived “service maps”) (A. Chakraborty, 2024; “Service Dependency Graph Analysis in Microservice Architecture,” 2020). The reason graphs matter for risk is simple: failures propagate along edges. If the payment service depends on identity, a database, and a third-party processor, then the payment service’s risk profile is a function of upstream and downstream behavior, not a local attribute. Graph theory makes this explicit: the impact surface of a component is related to its position and connectivity (e.g., path counts, cut sets, and centrality).
This is where traditional low/medium/high assessments break down. Consider two “high” risks: (a) a seldom-used batch job with a single internal dependency, and (b) a low-latency request path used by every customer interaction and dependent on multiple third parties. Both might be labeled “high,” but the business consequences and mitigation leverage are radically different. A graph gives a rigorous place to attach business meaning: edges represent value flow and failure propagation. It becomes possible to compute “blast radius” as a function of downstream consumers, critical paths, or customer-impacting expectations.
Expectation chains as empirical risk objects
NIST’s risk assessment framing emphasizes risk as a combination of likelihood and impact, influenced by threat events, vulnerabilities, and predisposing conditions, and it explicitly supports multiple risk models and levels of rigor (NIST, 2012). Expectation chains complement this by supplying an operationally convenient unit of measurement: the expectation statement, as illustrated below. Each expectation is (1) externally meaningful (it is about a promise), (2) empirically testable (it has probes/SLIs), and (3) graph-addressable (it sits at a node between provider and consumer).
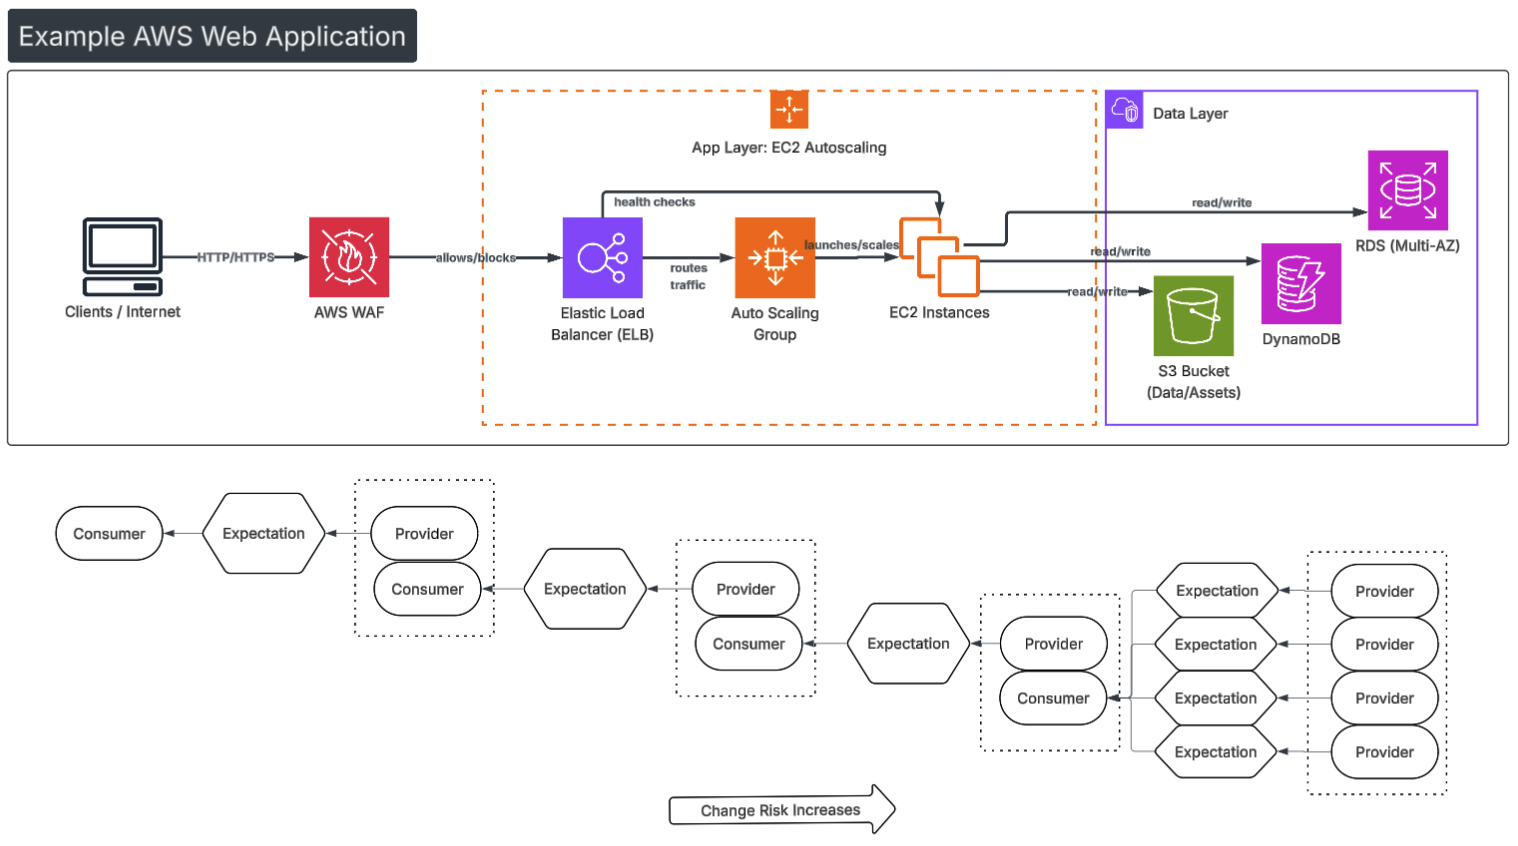
An expectation chain therefore becomes a continuously updated risk register where each risk assertion is coupled to evidence. Instead of “Database risk is high,” a SaaS operator can state: “Checkout depends on Inventory Read within 150 ms at p95, 99.9% over 30 days; the observed pass rate is 99.6% with clustered failures during region congestion; therefore, the residual risk to revenue conversion is elevated.” This is a risk assessment that can be audited because the measurements, windows, and thresholds are explicit. It can even go further and establish a dynamic numeric scale and report that risk is 85% (where the percentage is based on an auditable range of 0 to 1000).
This also aligns with SRE practice: Service Level Objectives (SLOs) are targets for reliability, and error budgets quantify allowable unreliability; these mechanisms support data-driven tradeoffs between feature velocity and reliability work (Beyer et al., 2018; Thurgood & Ferguson, 2023). Expectation chains generalize this idea across dependencies and across business layers: each expectation can be backed by an SLI and SLO, and the chain aggregates them to show where reliability “spend” is occurring and where it is being forced upstream.
Measuring dependency risk with graph-aware aggregation
A dependency graph is not valuable if it merely draws boxes and arrows. The value comes from aggregation rules that turn local observations into system-level risk statements. Expectation chains provide clean semantics:
- Local expectation health: Each probe yields pass/fail (or a scalar) for availability, reliability, and performance, evaluated against thresholds.
- Windowed health: Over a time window, health is the proportion of passes per axis, plus a combined score (e.g., conjunction across axes, or weighted composition).
- Chain health: A consumer-facing expectation is satisfied only if all required upstream expectations are satisfied under the chain’s semantics.
- Pool semantics: For redundant providers (e.g., a fleet behind a load balancer), the expectation is evaluated using quorum/percentile/capacity-weighted logic rather than strict conjunction, preserving realism in horizontally scaled systems.
These rules make risk comparable across services because every expectation is evaluated using the same measurement grammar. They also support “risk localization”: if a top-level business expectation fails, the chain can identify which upstream expectations most frequently violated thresholds during the window, and which edges correlate with customer-impacting outcomes.
Graph theory contributes additional rigor beyond simple rollups. In graph terms, customer value paths are walks through dependency edges; risk is concentrated where many critical paths converge. Service mapping literature highlights the role of service dependency graphs for understanding complex interactions and governance (e.g., topology and tracing-derived dependency views) (Chakraborty, 2024; “Service Dependency Graph Analysis in Microservice Architecture,” 2020). Once you have the graph, you can compute objective prioritization signals such as:
- Criticality via path participation: edges/nodes on many customer-facing paths have higher business leverage.
- Cut sets and single points of failure: nodes whose removal disconnects customer expectations indicate structural fragility.
- Change-risk intersection: components with high centrality and high deployment frequency are likely to be disproportionate incident sources.
- Third-party concentration risk: external dependencies that sit on multiple chains represent correlated failure domains.
These are not subjective labels; they are properties of the graph and observed traffic/telemetry.
From “expert judgement” to defensible, business-wide context
A common organizational failure mode is that each team runs its own risk process, producing incompatible vocabularies and incomparable ratings. Risk becomes a political artifact rather than an operational tool. NIST explicitly frames risk assessment as part of organizational risk management that must inform leadership decisions across tiers, not merely within a technical silo (NIST, 2012). Expectation chains operationalize that cross-tier requirement by giving the organization a shared unit of discourse: expectations tied to business outcomes.
For example, a business stakeholder can understand “checkout conversion depends on page load performance and payment authorization success.” Engineering can instrument those expectations, measure pass rates, and compute how upstream dependencies affect them. Security can attach threat and control evidence to the same expectation nodes (e.g., identity availability and correctness under attack conditions). Finance can attach revenue impact to failure windows. The graph becomes the business-wide context: it shows how local risks compose into customer risk and how mitigations reduce risk along the actual value path.
Minimizing risk through targeted interventions
The central advantage of expectation chains is that they shift risk mitigation from generic hardening to targeted, measurable interventions. In a dependency graph, not every improvement yields equal customer benefit. Graph-aware, expectation-driven risk minimization emphasizes:
- Reducing structural fragility: eliminate single points of failure, add redundancy, and decouple high-centrality nodes.
- Controlling propagation: apply timeouts, bulkheads, circuit breakers, backpressure, and load shedding where edges have historically amplified failures.
- Improving detection latency: instrument expectations at the boundary where business value is measured, not only at infrastructure layers.
- Aligning change management with error budgets: when an expectation’s error budget is exhausted, throttle risky deployments to services on critical paths (Thurgood & Ferguson, 2023).
- Third-party risk containment: treat external dependencies as first-class providers in the chain and demand measurable SLOs, while engineering fallbacks for known failure modes.
Because each change is evaluated against the expectation probes, mitigation is empirically defensible: “We invested in cache warming and a fallback path; the customer-facing expectation improved from 99.6% to 99.92% over 30 days, and correlated incident rate decreased.”
Adding probabilistic rigor when needed
Not all risk can be captured by thresholded SLIs. Some domains require explicit uncertainty modeling: latent faults, partial observability, and conditional failure dependencies (e.g., “this fails only when that is already degraded”). Probabilistic graphical models—especially Bayesian networks—provide a way to model conditional dependence structures and compute posterior probabilities given evidence (Bobbio et al., 2001). In safety and reliability contexts, Bayesian networks are commonly discussed as extensions/generalizations of fault trees that handle richer dependency and uncertainty structure (Bobbio et al., 2001; “Bayesian Networks in Safety and Reliability,” 2024). Recent work continues to explore Bayesian-network methodology for fault analysis and risk reasoning under uncertainty (e.g., structure development and data/engineering integration) (Kabir et al., 2024).
Expectation chains can serve as the operational substrate for such probabilistic reasoning. The expectation graph provides the qualitative structure (who depends on whom), while telemetry provides evidence streams. Where deterministic thresholds are sufficient, expectation health remains a clear pass/fail or SLO compliance measure. Where conditional reasoning is required, the same graph can be used to fit probabilistic models that estimate the likelihood of customer-impacting failures given partial signals (e.g., rising latency in a subset of dependencies). This hybrid approach preserves accessibility for day-to-day operations while enabling deeper quantitative analysis for high-severity risk domains.
Business value: risk becomes measurable, comparable, and governable
For a SaaS operator, the business value of expectation chains is that risk becomes a measurable property of value delivery rather than an abstract compliance artifact.
- Comparable prioritization: Teams can compare risks across systems using consistent expectation metrics and windows rather than incomparable “high” labels.
- Outcome alignment: Each technical metric is explicitly tied to a business expectation, improving stakeholder communication and reducing metric theater.
- Faster incident triage: Graph localization identifies which dependencies most likely broke the customer promise during the failure window, reducing mean time to innocence and mean time to restore.
- Governance with evidence: Leadership decisions about reliability investment, vendor selection, and architectural change can be justified with observed expectation performance and graph criticality.
In short, expectation chains do not replace risk management frameworks; they make them operational. NIST-style likelihood/impact reasoning remains the conceptual backbone for many organizations (NIST, 2012). Expectation chains provide the missing “measurement layer” that lets SaaS operators continuously update risk assessments with empirical evidence, while graph theory supplies the mathematical language to describe how risks compound, propagate, and concentrate.
Conclusion
Dependencies are the dominant shape of SaaS risk. Treating risk assessment as a subjective low/medium/high rating without graph context obscures where customer harm is generated and where mitigations have leverage. Expectation chains offer a disciplined alternative: represent the business as a dependency graph of measurable expectations, instrument those expectations with empirical probes, and aggregate them using graph-aware semantics to produce objective, defensible risk valuations. When needed, the same structure can support probabilistic reasoning (e.g., Bayesian networks) to model conditional dependencies and uncertainty. The result is a risk practice that is simultaneously technical and business-relevant: it visualizes risk where value flows, measures it with evidence, and minimizes it with targeted interventions that can be validated over time.
Happy Hacking!
Sam
References
Beyer, B., Jones, C., Petoff, J., & Murphy, N. R. (Eds.). (2018). Site reliability engineering: How Google runs production systems. O’Reilly Media.
Bobbio, A., Portinale, L., Minichino, M., & Ciancamerla, E. (2001). Comparing fault trees and Bayesian networks for dependability analysis. In Proceedings of the 19th International Conference on Computer Safety, Reliability and Security (SAFECOMP 2000). Springer. https://link.springer.com/content/pdf/10.1007/3-540-48249-0_27.pdf
Chakraborty, A. (2024). Generate microservices dependency graph for your applications. IBM Developer. https://developer.ibm.com/tutorials/awb-generate-microservices-dependency-graph-for-your-applications
Kabir, S., Gheraibia, Y., Alshammari, M., Papadopoulos, Y., & Aslansefat, K. (2024). A Bayesian network development methodology for fault analysis: Case studies and impact assessment. Reliability Engineering & System Safety. https://www.sciencedirect.com/science/article/pii/S0888327024003571
National Institute of Standards and Technology. (2012). Guide for conducting risk assessments (SP 800-30 Rev. 1). https://csrc.nist.gov/pubs/sp/800/30/r1/final
Service Dependency Graph Analysis in Microservice Architecture. (2020). In Proceedings (Springer chapter). https://link.springer.com/chapter/10.1007/978-3-030-61140-8_9
Thurgood, S., & Ferguson, D. (2023). Implementing SLOs. In The Site Reliability Workbook. Google. https://sre.google/workbook/implementing-slos/
Bayesian Networks in Safety and Reliability. (2024). ESREL 2024 Proceedings paper. https://esrel2024.com/wp-content/uploads/articles/part1/bayesian-networks-in-safety-and-reliability.pdf