
Expectation Chains: Observability by Design
Monitoring complex systems and the “black box” operations problem
Modern software services are complex sociotechnical systems: they comprise code, data stores, networks, vendor dependencies, runtime platforms, and the humans and processes that design, deploy, and operate them. As software engineering moved from single-host applications to distributed systems, that complexity became harder to “see” using traditional monitoring approaches. The canonical symptom is familiar: an outage or performance regression occurs, an alert fires, and teams scramble to determine what users are experiencing, why it is happening, and which subsystem is responsible. In this context, the core problem is not merely lack of data; it is lack of meaningful, decision-ready measurement that maps technical signals to the service outcomes the business and customer actually care about.
Historically, this problem was amplified by an organizational split between development and operations. “Operations” organizations were responsible for keeping systems available, but in many eras they were not the authors of the software they operated. They therefore monitored services as black boxes: they tested externally visible behavior “as a user would see it,” without direct access to internal application semantics, or without a mandate to change the application itself (Ewaschuk, 2016). In Google’s Site Reliability Engineering (SRE) framing, black-box monitoring is explicitly contrasted with white-box monitoring, which uses internal signals exposed by the system (Ewaschuk, 2016). The black-box posture is often rational under separation of concerns: if operations cannot modify the service, then externally visible symptoms are the only dependable basis for detection and escalation.
The industry’s frameworks and governance practices also codified this divide. Yes, folks, we shot ourselves in the foot! IT service management practices such as ITIL describe a lifecycle in which releases are moved from development into live environments with a “handover to service operations” orientation (ITIL v3 Service Transition, n.d.). Whatever the merits of controlled release and change governance, the organizational effect in many firms was a structural gap: the teams that built software and the teams that were paged for it did not share the same incentives, feedback loops, or even vocabulary for “what good looks like.” That gap was especially punishing for monitoring. Operations teams could measure CPU, memory, disk, and network availability, but these were often proxies for user experience, not direct measures of delivered value. When incidents occurred, the result was frequently blame-shifting (“it’s the code” vs. “it’s the machines”), long mean time to resolution, and monitoring systems that grew in complexity without necessarily increasing understanding.
DevOps, SaaS, and the rise of built-in observability
The DevOps movement emerged, in part, as a reaction to this split. A frequently cited inflection point was the “10+ Deploys Per Day” talk describing cooperation between development and operations at Flickr (Allspaw & Hammond, 2009). The point was not merely higher deployment frequency; it was a reconfiguration of the relationship between code and production. Rapid feedback from production becomes an engineering input, not an operational afterthought. The name “DevOps” itself was popularized through the DevOpsDays community that formed shortly thereafter (New Relic, 2014).
In parallel, the industry’s shift toward Software-as-a-Service (SaaS) altered the feasibility frontier for instrumentation. A SaaS provider runs the service; consequently, it can embed telemetry, structured logs, traces, and domain-specific measurements directly into the application and its platforms. This is the core “white-box advantage”: the builder of the system can choose what signals to expose, how to correlate them, and how to tie them to user journeys and business outcomes (Ewaschuk, 2016). This advantage scales as systems become more distributed. Observability has increasingly been described as the ability to understand internal state from outputs such as logs, metrics, and traces—often summarized as the “three pillars” of observability (IBM, n.d.). More importantly, observability has been advanced as a property of a system designed and operated with the expectation that distributed systems are pathologically unpredictable (Sridharan, 2018). If unpredictability is normal, then relying on a small set of pre-defined dashboards becomes insufficient; teams need the ability to ask novel questions of production telemetry.
Standardization efforts further enabled this shift. OpenTelemetry (OTel) provides a vendor-neutral framework for generating and exporting telemetry signals (OpenTelemetry, 2025). Vendor-neutral instrumentation matters because it lowers switching costs and encourages early instrumentation: teams can instrument first, decide on backends later, and avoid becoming trapped by tool-driven data models. The strategic consequence is that “instrumentation” can be treated as an engineering concern, not a post-hoc operational hack.
The persistent industry failure mode: observability as an afterthought
Despite the availability of modern tools and practices, many organizations still build the product first and “add monitoring” afterward. This failure mode is often driven by local incentives: feature velocity is visible, while observability is treated as non-functional overhead. When observability is deferred, teams typically pay for it later in at least four ways.
-
Retrofitting is expensive
Instrumentation requires intimate knowledge of execution pathways. It is easier to add a stable event model, consistent identifiers, and meaningful domain metrics during feature implementation than to reconstruct intent after the fact.
High Noise-to-Signal Ratio
Second, ad-hoc monitoring tends to maximize the volume of data rather than usefulness. Teams add metrics because they are easy, add logs because they are familiar, then discover that the resulting telemetry is high cardinality in the wrong places, low cardinality in the right places, and hard to correlate across services.
Higher Toil Increases Labor Costs
Third, deferred observability increases operational toil: humans become part of the control loop, repeatedly performing investigative work that could have been made cheaper through better measurement and automation. SRE explicitly frames human interruption as costly and emphasizes that pages should be actionable and tied to user impact (Ewaschuk, 2016). Fourth, the business outcome becomes distorted: teams optimize what is measurable (infrastructure health proxies) rather than what is valuable (customer-facing outcomes).
Empirical research on delivery and operations performance reinforces the economic stakes. The DORA research program, spanning large multi-year datasets, has consistently argued that delivery and operations capabilities correlate with organizational performance outcomes, and it has promoted a small set of performance metrics as an industry standard for delivery performance measurement (DORA, 2024; Google Cloud, 2024). While DORA’s scope is broader than observability alone, the implication is direct: organizations that cannot accurately measure and improve system outcomes struggle to improve delivery and operational performance in a sustainable way. Put differently, “observability as an afterthought” is a tax on both reliability and velocity.
The deeper issue is definitional: traditional monitoring often answers “is something wrong?” while observability should help answer “what is happening, why, and where?” (Sridharan, 2018). Without a principled measurement model that connects provider behavior to consumer-valued outcomes, monitoring investments can become a form of waste—large spend, high alert volume, and limited improvement in decision quality.
From Observability to Expectation: measuring service/value
Expectation Chains proposes that the fundamental unit of observability is not a host, a process, or even a “service” in the platform sense. The fundamental unit is an Expectation: a measurable statement of the service/value a provider must deliver to a consumer. In the simplest form (as in the provided diagram), a Provider delivers value to a Consumer, and the Expectation is the measurement contract that determines whether the value delivered is acceptable. Value flows from provider to consumer, while accountability flows through the expectation: the consumer judges success by whether the expectation is met.
This framing resolves a recurring observability ambiguity: teams often instrument “everything,” but they do not agree on what “good” means. Expectation Chains inverts the process: define what “good” means first—explicitly, measurably—and then collect the minimum telemetry required to evaluate that definition continuously. The approach is aligned with SRE’s insistence that alerting and measurement should be tied to user impact and actionable response (Ewaschuk, 2016), but it generalizes beyond alerting into an explicit graph of dependencies and responsibilities.
A Minimal Expectation Chain
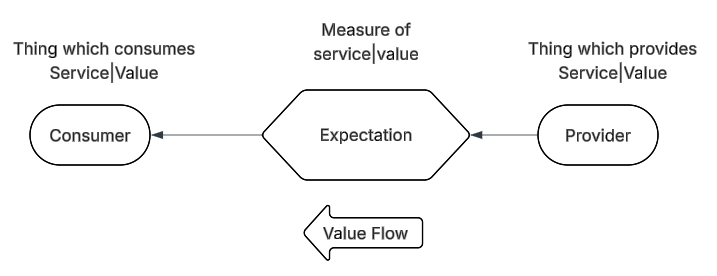
Consider a SaaS web application. The end-user (consumer) expects that “navigating to the application returns the correct page within a time budget.” The application (provider) delivers that value. The expectation is the measurable promise: for example, availability on HTTPS/443, correctness of returned content for a given request, and latency within a defined threshold. This echoes the SRE principle that monitoring should prioritize user-visible signals and that black-box tests can validate externally visible behavior (Ewaschuk, 2016). However, Expectation Chains insists that the expectation be the primary node in the model, not merely an alert rule buried inside tooling.
At this level, the expectation is evaluated using a combination of black-box probes (synthetic checks, user-journey tests) and white-box signals (internal metrics and traces) as needed. The objective is not maximal telemetry, but a defensible measurement that can be interpreted in business terms.
Recursive expansion: from user expectation to subsystem expectations
The central power of Expectation Chains is recursion. Once an end-user expectation is defined, the provider can be treated as a consumer of its dependencies, and each dependency relationship becomes its own provider–expectation–consumer triad.
For example, a web application’s ability to serve requests depends on:
- An API layer (internal services)
- A database (data persistence and query performance)
- A CDN or edge network (content delivery and caching)
- Third-party services (payments, email, analytics)
Each of these is a provider that delivers a service/value to the upstream consumer (the web app). Each relationship therefore needs its own expectation, expressed in measurable terms. Importantly, these expectations should be expressed in the consumer’s language—what the consumer needs from the provider to meet the consumer’s own upstream promises. This pushes observability design into the architecture phase: service boundaries become not only code boundaries, but measurement boundaries.
This recursive decomposition aligns with the practical reality of distributed debugging. When an end-user experience is degraded, teams need to localize the failure domain quickly. Telemetry alone does not do this unless it is aligned with dependency relationships and correlated across boundaries. Standardized tracing and context propagation (e.g., via OpenTelemetry) help connect signals across services, but Expectation Chains provides the semantic structure that explains why those signals matter and which expectations they threaten (OpenTelemetry, 2025).
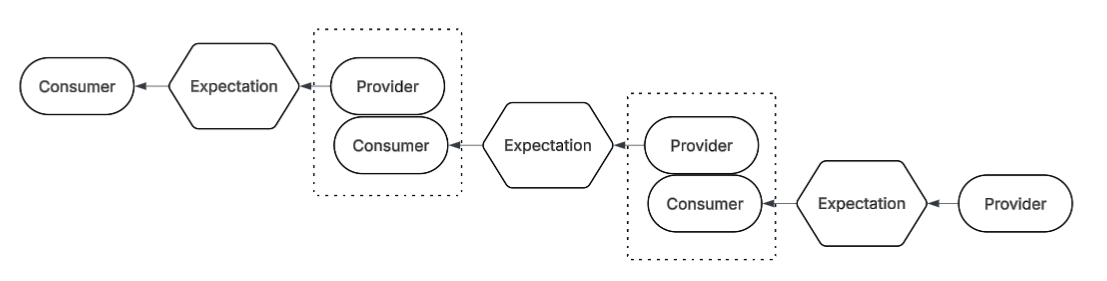
Extending downward: lowest technical levels
Recursion can continue below the “application” boundary into infrastructure and facilities, where operations has traditionally excelled. A database service depends on:
- Compute capacity (saturation and headroom)
- Storage durability and performance
- Network reliability and latency
- Power and cooling availability
- Cloud provider or colocation vendor commitments
Here, Expectation Chains provides a way to integrate what are often separate monitoring domains into one consumer-centered model. Facility power becomes a provider; the data center electrical subsystem becomes a consumer; the expectation might be expressed as uptime, voltage stability, or failover capability. Vendor relationships similarly become expectations: a cloud provider region might be evaluated against uptime commitments or incident rates, while acknowledging that such measurements may require indirect indicators.
This is not a claim that organizations can fully instrument vendors; it is a claim that vendor dependencies still represent expectations that can be measured, even if measurement must be probabilistic or inferential. In other words, “we cannot see inside the vendor” does not eliminate the need to model the dependency; it makes the expectation node even more important because it forces explicit acknowledgment of the risk and the measurement limitations.
Extending sideways and upward: sociotechnical expectations
A key contribution of Expectation Chains is that it treats non-technical dependencies as first-class citizens. Software services depend on humans and organizations:
- On-Call response teams
- Customer support
- Security incident response
- Release management and change enablement
- Product owners and business stakeholders
- Development teams maintaining subsystems
ITIL’s lifecycle perspective explicitly emphasizes that services must be transitioned into operations in a coordinated way, including preparing support staff for change (Atlassian, n.d.; ITIL v3 Service Transition, n.d.). Expectation Chains operationalizes that coordination by making such dependencies measurable.
For instance, if an SRE team is responsible for incident response, the rest of the organization has expectations of that team: time-to-acknowledge, time-to-mitigate, escalation correctness, and post-incident learning outcomes. Similarly, business stakeholders are providers of prioritization and clarity; engineering is a consumer of that clarity. If priorities churn weekly, the downstream expectation—stable delivery capacity—cannot be met. DORA’s research emphasis on user-centricity and stable priorities for success is consistent with this view: performance is not solely technical; it emerges from leadership, prioritization, and team capabilities (DORA, 2024).
By making these dependencies explicit, Expectation Chains reframes “observability” as an organizational measurement discipline rather than a tooling category. Tools collect telemetry; expectation models interpret it.
Why Expectation Chains improves outcomes
Expectation Chains addresses the earlier failure modes—black-box operations, deferred observability, and waste—through a set of structural commitments.
- Consumer-centered measurement. Expectations are defined from the consumer’s standpoint, which naturally ties technical signals to business outcomes. This complements SRE’s emphasis that monitoring should focus on user impact and actionable intervention (Ewaschuk, 2016).
- Composability. Because chains are recursive, measurement scales with architecture. As teams decompose monoliths into services, they also decompose expectations into contracts. This reduces ambiguity: a service is “healthy” if it meets its expectations, not merely if its CPU is low.
- Balanced black-box and white-box strategy. Expectation Chains does not reject black-box monitoring; it elevates it to its correct role: validating user-visible behavior (Ewaschuk, 2016). White-box signals then exist to explain and localize failures when the black-box expectation fails. This reduces alert fatigue and avoids overfitting instrumentation to internal implementation details that change frequently.
- Early instrumentation by design. When expectations are defined alongside service interfaces, instrumentation becomes part of feature completion, not post-hoc rework. OpenTelemetry’s vendor-neutral approach supports this by lowering the long-term risk of early instrumentation decisions (OpenTelemetry, 2025). This also aligns with test-driven development when synthetics testing is used to validate software quality. Those tests, if well-designed, can be used to observe system health over the entire lifecycle, maximizing the return on investment for engineering effort.
- A unified model for sociotechnical reliability. Incidents are rarely “just a bug.” They are often the product of coupled failures—technical, procedural, and organizational. Expectation Chains allow these to be modeled explicitly, supporting learning and remediation in a way that aligns with modern reliability practices.
Conclusion
The industry’s historical split between development and operations left many organizations with a black-box monitoring posture: operations could test external behavior but could not easily instrument or reshape the application’s internal signals. The DevOps and SaaS era made built-in observability more feasible: teams increasingly own the full lifecycle and can instrument systems directly, supported by standardization efforts such as OpenTelemetry. Yet the most persistent failure mode remains cultural and architectural: observability is postponed until after product delivery, leading to costly retrofits, noisy monitoring, and weak alignment with business outcomes.
Expectation Chains proposes a corrective: define Expectation as the primary unit of observability—a measurable service/value contract between provider and consumer—and use recursive decomposition to map end-user outcomes through interconnected technical and non-technical subsystems. In doing so, it turns “monitoring” from an accumulation of signals into a disciplined measurement of value delivery. The result is not only better incident response and faster debugging, but a more accurate representation of whether the system is delivering what customers and stakeholders actually expect.
References
Allspaw, J., & Hammond, P. (2009). 10+ deploys per day: Dev and ops cooperation at Flickr [Conference presentation]. O’Reilly Velocity Conference. https://www.youtube.com/watch?v=LdOe18KhtT4
Atlassian. (n.d.). ITIL service transition: Principles, benefits, and processes. https://www.atlassian.com/itsm/itil/service-transition
Caldwell, S. (2025). Expectation chains for observability and value assurance [Unpublished manuscript].
DORA. (2024). Accelerate State of DevOps Report 2024. https://dora.dev/research/2024/dora-report/
Ewaschuk, R. (2016). Monitoring distributed systems. In B. Beyer, C. Jones, J. Petoff, & N. R. Murphy (Eds.), Site reliability engineering: How Google runs production systems (Chapter 6). https://sre.google/sre-book/monitoring-distributed-systems/
Google Cloud. (2024). Announcing the 2024 DORA report. https://cloud.google.com/blog/products/devops-sre/announcing-the-2024-dora-report
IBM. (n.d.). Three pillars of observability: Logs, metrics and traces. https://www.ibm.com/think/insights/observability-pillars
ITIL v3 Service Transition. (n.d.). Release and deployment management (Chapter 4.4). https://hci-itil.com/ITIL_v3/books/3_service_transition/service_transition_ch4_4.html
New Relic. (2014). The incredible true story of how DevOps got its name. https://newrelic.com/blog/nerd-life/devops-name
OpenTelemetry. (2025). OpenTelemetry documentation. https://opentelemetry.io/docs/
Sridharan, C. (2018). Distributed systems observability: A guide to building robust systems. O’Reilly Media. https://unlimited.humio.com/rs/756-LMY-106/images/Distributed-Systems-Observability-eBook.pdf
Happy Hacking!
Sam